Burbank Water and Power (BWP) is a 50,000-customer, community-owned municipal utility in the Los Angeles area. BWP has implemented an advanced smart grid network, and did so with no rate increase to consumers. How did they do this?

BWP received a U.S. Department of Energy (DOE) Smart Grid Investment Grant (SGIG) as well as a grant from the California Energy Commission (CEC). These grants paid for approximately 40 percent of the $50 million in equipment, software, and training costs, and provided a big head start on deployment without a rate increase. With lower costs today, a utility moving forward might not pay much more for their system in total than BWP spent out of pocket in 2010-2012.
The BWP system includes smart meters, a WiFi mesh communications network to collect data, a fiber-optic network ring around the service territory to aggregate the data, and a meter data management system. In addition, it includes hardware and software for water meter reading, an outage management system, and other features.
Cost Savings from Smart Grid

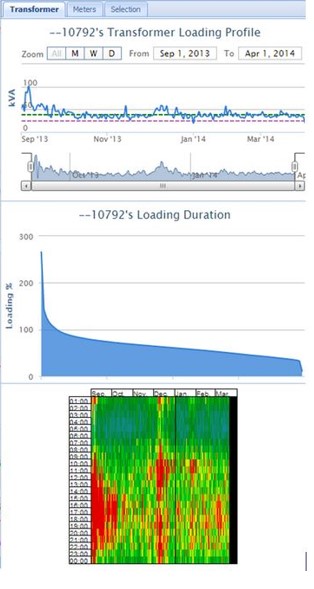
One of the applications used to maximize the value of the smart grid investment in Burbank was a software package known as GridView, from Landis & Gyr, which essentially performs predictive analytics on the system. One example is using the data from the smart meters (interval data on each customer usage) in conjunction with data from the geographic information system (locational data of each customer on the distribution network) to produce a “heat map” for each transformer on the system. An example for one transformer is shown to the right.
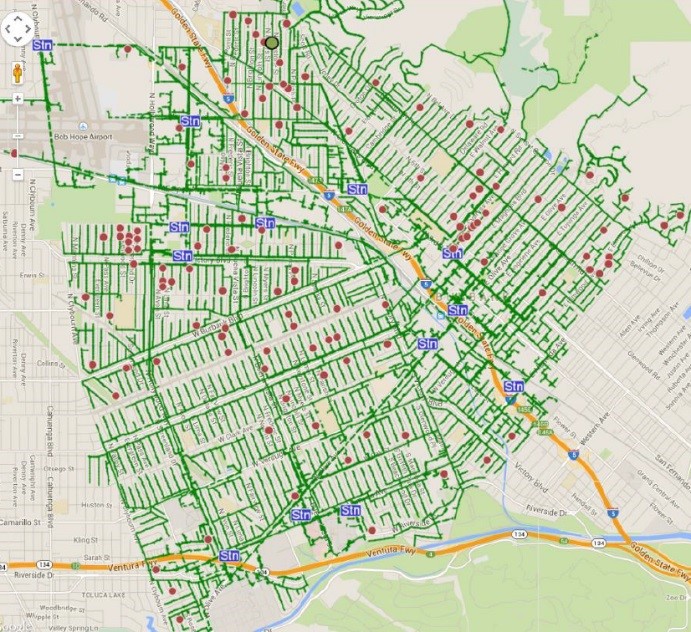
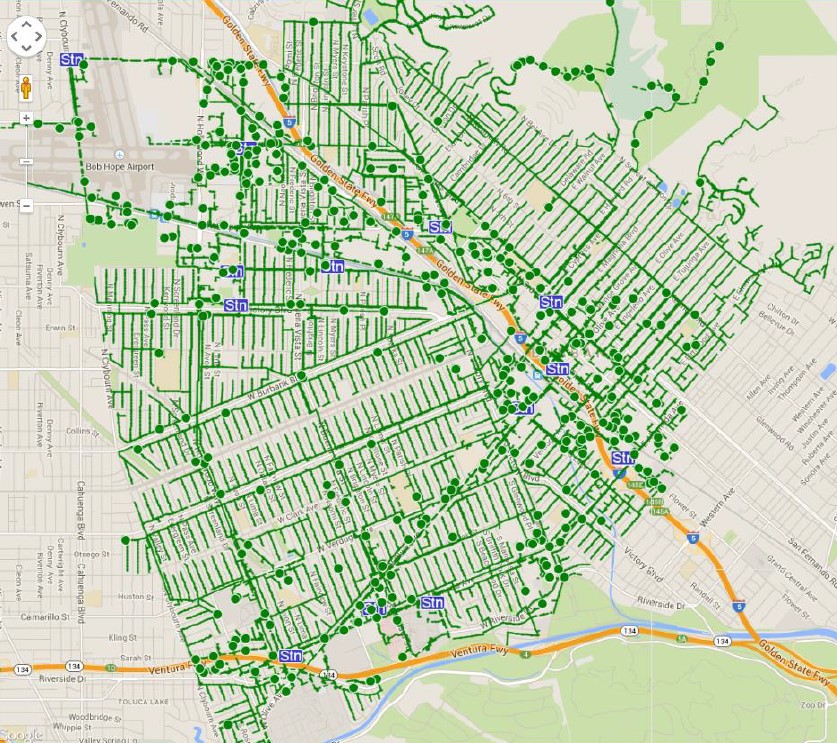
These heat maps enabled the utility to identify more than 500 oversized distribution transformers and about 50 that were dangerously undersized. Oversized transformers experience excessive core losses (associated with energizing the transformer), while undersized transformers have high resistive losses and can fail suddenly, leaving customers without power.
The red dots in the next figure show the undersized transformers. While limited in number, they were enough to pose serious reliability concerns for hundreds of customers. BWP made the up-sizing of these transformers an immediate priority for their line crews.

The green dots in the last figure show the oversized transformers. A much higher percentage of the transformers on the system had excess capacity, in part due to significant energy conservation achievements since the circuits were designed, but also due to better data on customer usage than was available in the past.

Burbank moved its transformers around to “right-size” each transformer. They only needed to purchase a few new transformers, where the only choice from the existing fleet was an older, less-efficient transformer with high losses. As a result, Burbank achieved a significant reduction in distribution line losses and avoided outages during a heat wave the following summer. Neighboring utilities experienced numerous transformer failures during the same heat wave.
In addition, Burbank’s other distribution automation equipment and sensors enabled and detected better phase balancing, circuit loadings, and low voltage, enabling it to improve power quality and further reduce line losses.
Because line losses and transformer losses are exponential as load increases, dealing with the overloaded transformers and circuits provided significant line loss savings. For more information on how substantial these savings can be, see the RAP publication Valuing the Contribution of Energy Efficiency to Avoided Marginal Line Losses (co-authored by the principal electrical engineer at Burbank Water and Power at the time it was written).
With about $100 million in annual power supply costs, BWP’s achievement of 1 percent in line loss reduction is worth about $1 million per year, a significant offset to the system capital cost.
Distribution Automation Benefits
Distribution automation activities include microprocessor-based relays and automatic reclosers on all 74 of its 4-kV feeders and 36 of its 12-kV feeders. The only feeders not included are completely underground. The relays have the capability to detect faults and automatically reclose circuit breakers after momentary faults clear. The auto-recloser system has reduced customer outage time by approximately 1 million customer minutes annually since it was implemented five years ago.
Reduced Customer Service Expenses
BWP has eliminated many customer service expenses. Meter reading expenses are gone. There is no need to dispatch line workers to disconnect or reconnect service (disconnection, when necessary, can now be done remotely after appropriate customer notification and attempts to avoid disconnection by a customer service specialist with language skills to match the customer’s situation). Reconnection can occur at any time of the day or night, through the utility SCADA center.
Prior to its smart grid investment, BWP had manual meter reading, and 23 billing cycles each month. With smart grid and the associated meter data management system and billing engine, BWP is able to read all meters and bill customers based on an optimized schedule. Not surprisingly, billing costs are down.
Combined Savings: About $2 Million a Year
The combined savings from line loss reductions, reduced truck rolls, reduced meter reading expenses, and reduced mailing costs comes to about $2 million per year. These savings will pay off BWP’s share of its smart grid network in 15 years, well within the expected lifetime of the system.
And BWP is now among the most reliable utilities in the nation, with a 99.99 percent electric service availability rate and with SAIDI and SAIFI ratings in the top 2 percent of all utilities.
Time-of-Use Rates Now Possible
With advanced metering, data collection, and data management, BWP has extended time-of-use pricing to all of its general service customers, starting with the largest customers, but extended to the smallest neighborhood shops and offices in fiscal year 2016. An optional residential TOU rate has been offered to electric vehicle households to encourage off-peak charging; more widespread residential TOU is being studied for future deployment. The small general service rate is simple, cost-based, and effective:
Burbank Schedule C (Small Commercial)
| Summer | Winter | |
| Customer Charge 1-Phase | $9.78 | $9.78 |
| Customer Charge 3-Phase | $12.21 | $12.21 |
| Off-Peak | $.1267 | $.1267 |
| Mid-Peak | $.1584 | $.1584 |
| On-Peak | $.2535 | $.1584 |
But Wait—There’s More!
Once the system was up and running, with reliable metering data being fed to the billing engine, BWP management asked: “What else can we do with this system?”
The Wi-Fi mesh and fiber optic network could read all the meters in a short period overnight, but it could also provide valuable community benefits.

As part of Burbank’s asset utilization strategy within the comprehensive smart grid communications network, BWP is maximizing its unused assets and promoting community economic development by offering competitively priced fiber optic services and high-speed internet to businesses within the City of Burbank. Known as ONE Burbank, the program has been very well received and is an enterprise revenue generator.
Another community benefit was BWP’s best effort: free citywide Wi-Fi service. The system can handle about 10,000 connections at one time, without interfering with the utility’s use of the network for distribution system monitoring and operations. Even low-income students, with a basic tablet or computer, can access the internet for homework, email, and other purposes. The utility intentionally keeps the bandwidth limited, both to ensure that all users have access and to avoid competing with local broadband carriers.

Burbank’s experience shows what can be done by utilities—through the thoughtful use of available new technologies—to benefit their own operations and overall quality of life in the communities they serve. BWP may be a leader in recognizing and realizing these opportunities, but it is hardly unique in having them.
Thanks to Sean Swe, Jim Compton, and Joe Flores at Burbank Water and Power for help with this blog post.
