California curtailed renewables this spring. This sets off alarm bells in some quarters because it suggests that solar and wind are overbuilt and present a big challenge to the grid. The concerns, however, are misplaced, and solutions are at hand.
Here’s the situation. The California ISO (CAISO) experienced negative power prices during the solar day, and curtailed renewable energy this spring, during daytime hours when solar production is high. This is not unexpected, it’s just happening faster than people thought it would. (The pace of solar deployment has already reached levels anticipated for 2020.) As a result of lower spring loads, high levels of spring hydro production, and higher-than-typical wind production, some central station solar and wind projects were curtailed. The curtailment amounted to about five percent of renewable energy production.
The graph below shows hourly day-ahead prices for the second Sunday in April for 2012 and 2017. Sunday is a day with low customer loads, but the sun does not take weekends off. With about 12,000 MW of solar added to the CAISO resource mix since 2012, the results are dramatic, but expected.
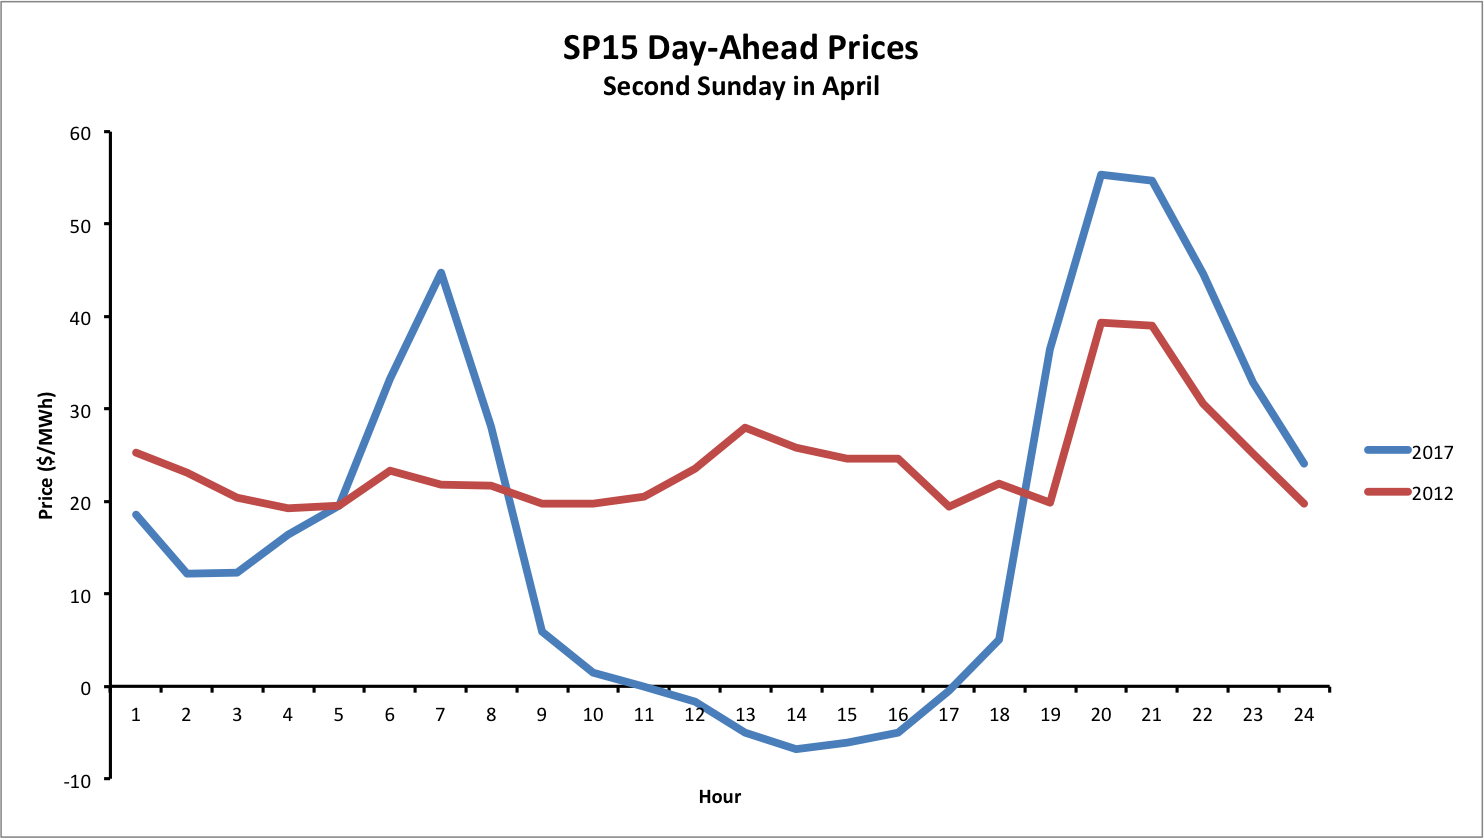
Source: Energy Institute at Haas
Here’s a graphic of how the CAISO met its loads during this same day.
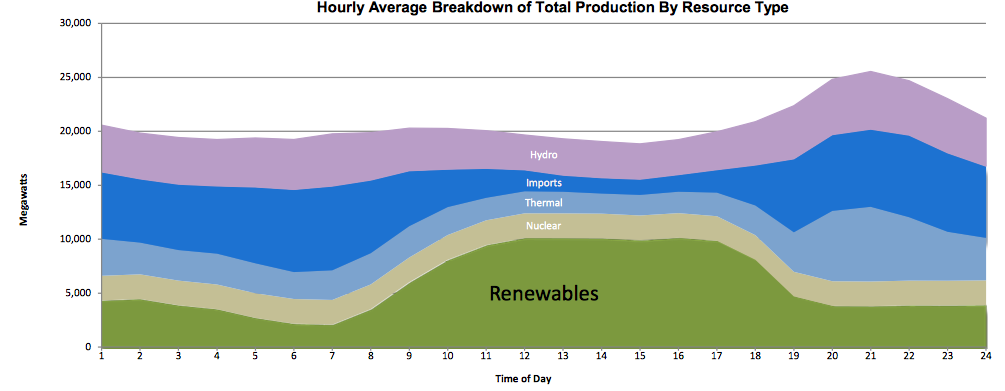
Source: Energy Institute at Haas
The graphic above, however, shows that the nuclear units at Diablo Canyon were running during the negative-price hours. My guess is that some of the “imports” that continued through the negative-price hours were coming from the Palo Verde nuclear units.
The Bonneville Power Administration periodically requests that the Columbia Generating Station reduce output for economic dispatch, even during times when refueling is not needed. No point in burning up nuclear fuel to produce negative-value power (existing nuclear units generally cannot be ramped up and down on an hourly basis, although there are new designs that might be able to).
Could these Diablo and Palo Verde units also have been taken down for a few weeks? Almost certainly the economic (and environmental) question is whether that would be needed (or if the hydro system could provide the needed flexibility), and, if so, whether it makes economic sense to do so. This is not a trivial question.
For hydro power operators, meanwhile, the return of wet weather to California meant some particular constraints this spring. Dams were being run to meet their flood control rule curves, meaning they MUST release enough water (generally through the turbines) to ensure that melting snow above has reservoir space. Fishery management was also an issue; some hydro units must generate (rather than spill) to avoid nitrogen supersaturation in spilled water, which is a contributor to gas bubble disease in juvenile salmonids.
And the California Renewable Portfolio Standard and the Federal Production Tax Credit provide an incentive to operate fully dispatchable renewables (it’s not hard to feather the props of a wind turbine) at negative market prices; that’s a human-made (and human-solvable) challenge.
Regardless, the wind and solar curtailment this spring in California was a fraction of the total renewable production. The graphic below shows one day of renewable curtailment, for Saturday, April 8. The maximum curtailment in one hour was less than 2,000 MW, compared with over 10,000 MW that was taken into the system, and the curtailment was only for a portion of the solar day.
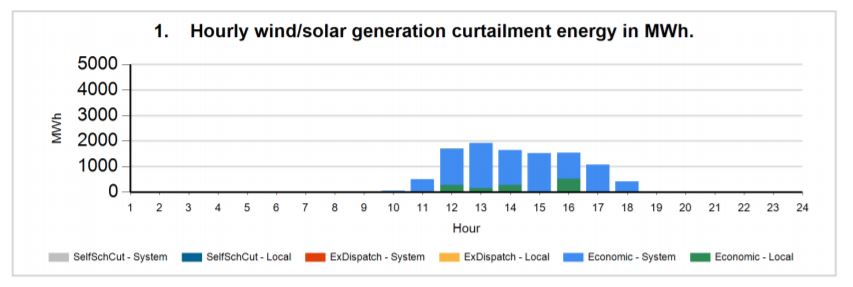
Source: CAISO
A Big Deal? Or Not So Much?
So that’s the background. And here is the question: Is this a crisis, or even a really big challenge?
We’ve never considered it to be a crisis when we do not operate our oil, natural gas, or coal plants to the limit of their availability. We call that “economic dispatch” and we consider it to be normal.
So why is it a big deal if a few hours a day of a few days in a few weeks of the year, in a really wet hydro year (California at 180 percent of average; the Pacific Northwest at 130 percent of average) that we have a surplus of renewable energy? Are we looking at a double standard?
Seems more like having a little bit of frosting left in the bowl after making the cake. Any 4-year-old knows what to do in that situation: find a secondary use for the surplus, through load shifting, storage, or load augmentation. It does not need to go onto the cake.
There are a number of loads we could shift into this period.
First, California has a very low saturation of electric water heating. By replacing gas water heaters with electric heat pump water heaters, we could be heating water at midday on sunny days (and overnight on windy nights), for use all day and night. A heat pump water heater has about 300 percent efficiency producing hot water; a modern gas power plant operates at about 60 percent efficiency turning gas into electricity. Even using gas-fired electricity, we’d use about half as much gas to heat water this way than we do with conventional gas water heaters. And, if we control the water heaters primarily into hours when the sun is shining and the wind is blowing, we can serve that load with renewable electricity, including energy that might otherwise be curtailed. Water heaters only run two to three hours per day to provide a household with their daily needs, and can store the water for 24 hours or longer from when it is heated until it is used for showers, laundry, and other uses. We know we must stop using natural gas for space and water heating to achieve an 80 percent reduction in CO2 emissions by 2050, so why wait until 2049?
Second, we could be using ice-storage air-conditioners to make “cool” at 10 a.m. when excess solar is available, and then use it to condition buildings at 6 p.m. Buildings in New York, Florida, and Texas use ice storage (and campuses like the University of California at Riverside use chilled water storage) extensively—but there are challenges to getting these units approved for California, because they may use a few more total kilowatt-hours over the course of a year (though this use can be concentrated into low-cost and renewable-rich hours). California building codes need to be updated to recognize this changed reality—that a few more kilowatt-hours is not a sin if they are cheap, off-peak, and mostly renewable kilowatt-hours.
Smart Rates Could Help
We could modify commercial electric rates to eliminate demand charges during the middle of the day, and move those costs into the evening time-of-use (TOU) energy rates. And we could adopt TOU rates for all classes with the highest rates in the evening, and lowest in the middle of the day.
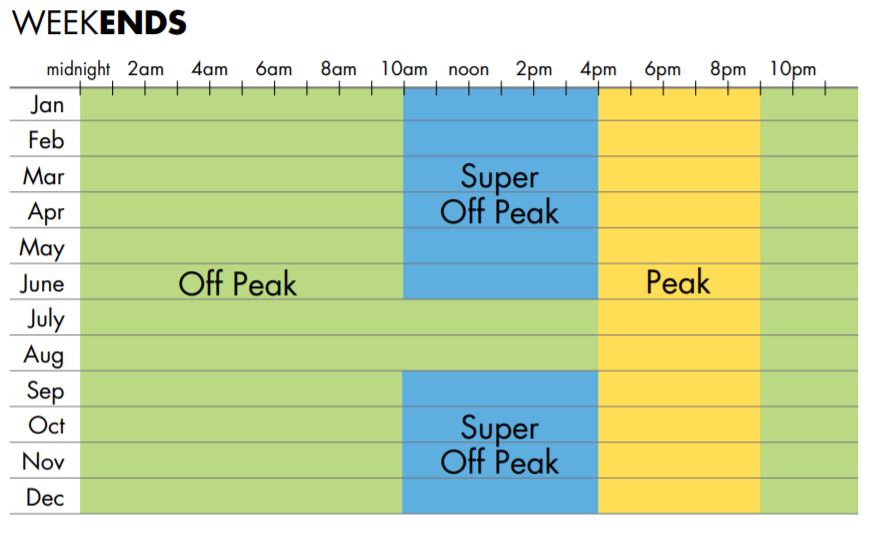
The CAISO recommended two years ago that midday in the spring be designated as a super-off-peak period. But utilities and the CPUC have yet to respond.
Source: Scientific American
Why do California commercial and industrial rates mostly still include 12-6 p.m. as the “on-peak” or “mid-peak” period? This rate structure is mired in the past. Even Southern California Edison’s irrigation pumping rate sets the “on-peak” highest price during midday year-round and defines “super-off-peak” to mean midnight to 6 a.m. Farmers can often reschedule pumping into low-cost hours, but most rate designs give them an incentive to pump continuously, not to concentrate pumping during the middle part of the day—when it could be fueled by solar. The same is true for electric vehicle owners, who could often charge during the solar day if the prices were right.
We have a NEW “super-off-peak” period during the spring months. There was a California PUC decision last year to allow utilities to offer a super-off-peak rate in the spring, but the standard rates still make midday the highest cost period. And California utilities continue to apply demand charges even during the low-cost midday hours, encouraging customers to curtail usage when it’s actually desirable for them to augment usage.
The Hawaii interim (optional) TOU rate does exactly that: from 9 a.m. to 5 p.m. (the belly of the duck) are the lowest-cost periods of the day, while 5 p.m. to 10 p.m. (the neck of the duck) are the highest-cost periods.
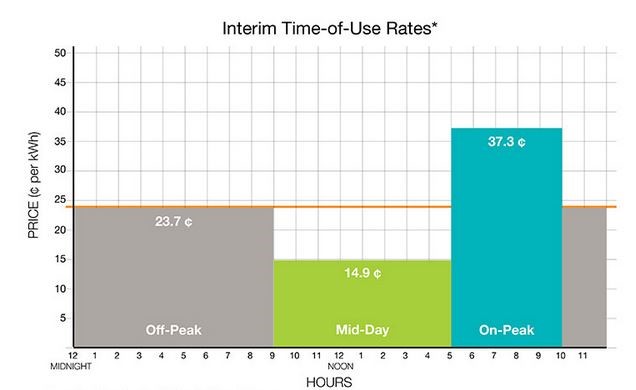
Source: Hawaiian Electric Company
California could have adopted a similar rate design for commercial customers two years ago when the CAISO proposed this change. There is progress underway, but it is moving slower than the rate of solar deployment. Indeed, several California utilities have proposed realigning their on-peak periods to the new reality—where midday is a lower-cost period. But the changes were not implemented prior to the spring runoff.
All of this is a challenge, yes, but not a crisis. It comes down to a few hours a day, a few days a year, because solar production increased faster than system flexibility did. The best solution is to step up the system flexibility, not slow down the clean energy deployment.
The fact that strategies to adapt loads to resources exist makes clear that this is not a calamity. Instead, the situation presents an opportunity to use tools that we already have, tools for which states will likely find increasing use in the future. See Teaching the Duck to Fly for a discussion of ten strategies to align loads to resources and resources to load.
